Key Monitoring Metrics of TiKV
If you use TiUP to deploy the TiDB cluster, the monitoring system (Prometheus/Grafana) is deployed at the same time. For more information, see Overview of the Monitoring Framework.
The Grafana dashboard is divided into a series of sub dashboards which include Overview, PD, TiDB, TiKV, Node_exporter, and Performance_overview. A lot of metrics are there to help you diagnose.
TiKV-Details dashboard
You can get an overview of the component TiKV status from the TiKV-Details dashboard, where the key metrics are displayed. According to the Performance Map, you can check whether the status of the cluster is as expected.
This section provides a detailed description of these key metrics on the TiKV-Details dashboard.
Cluster
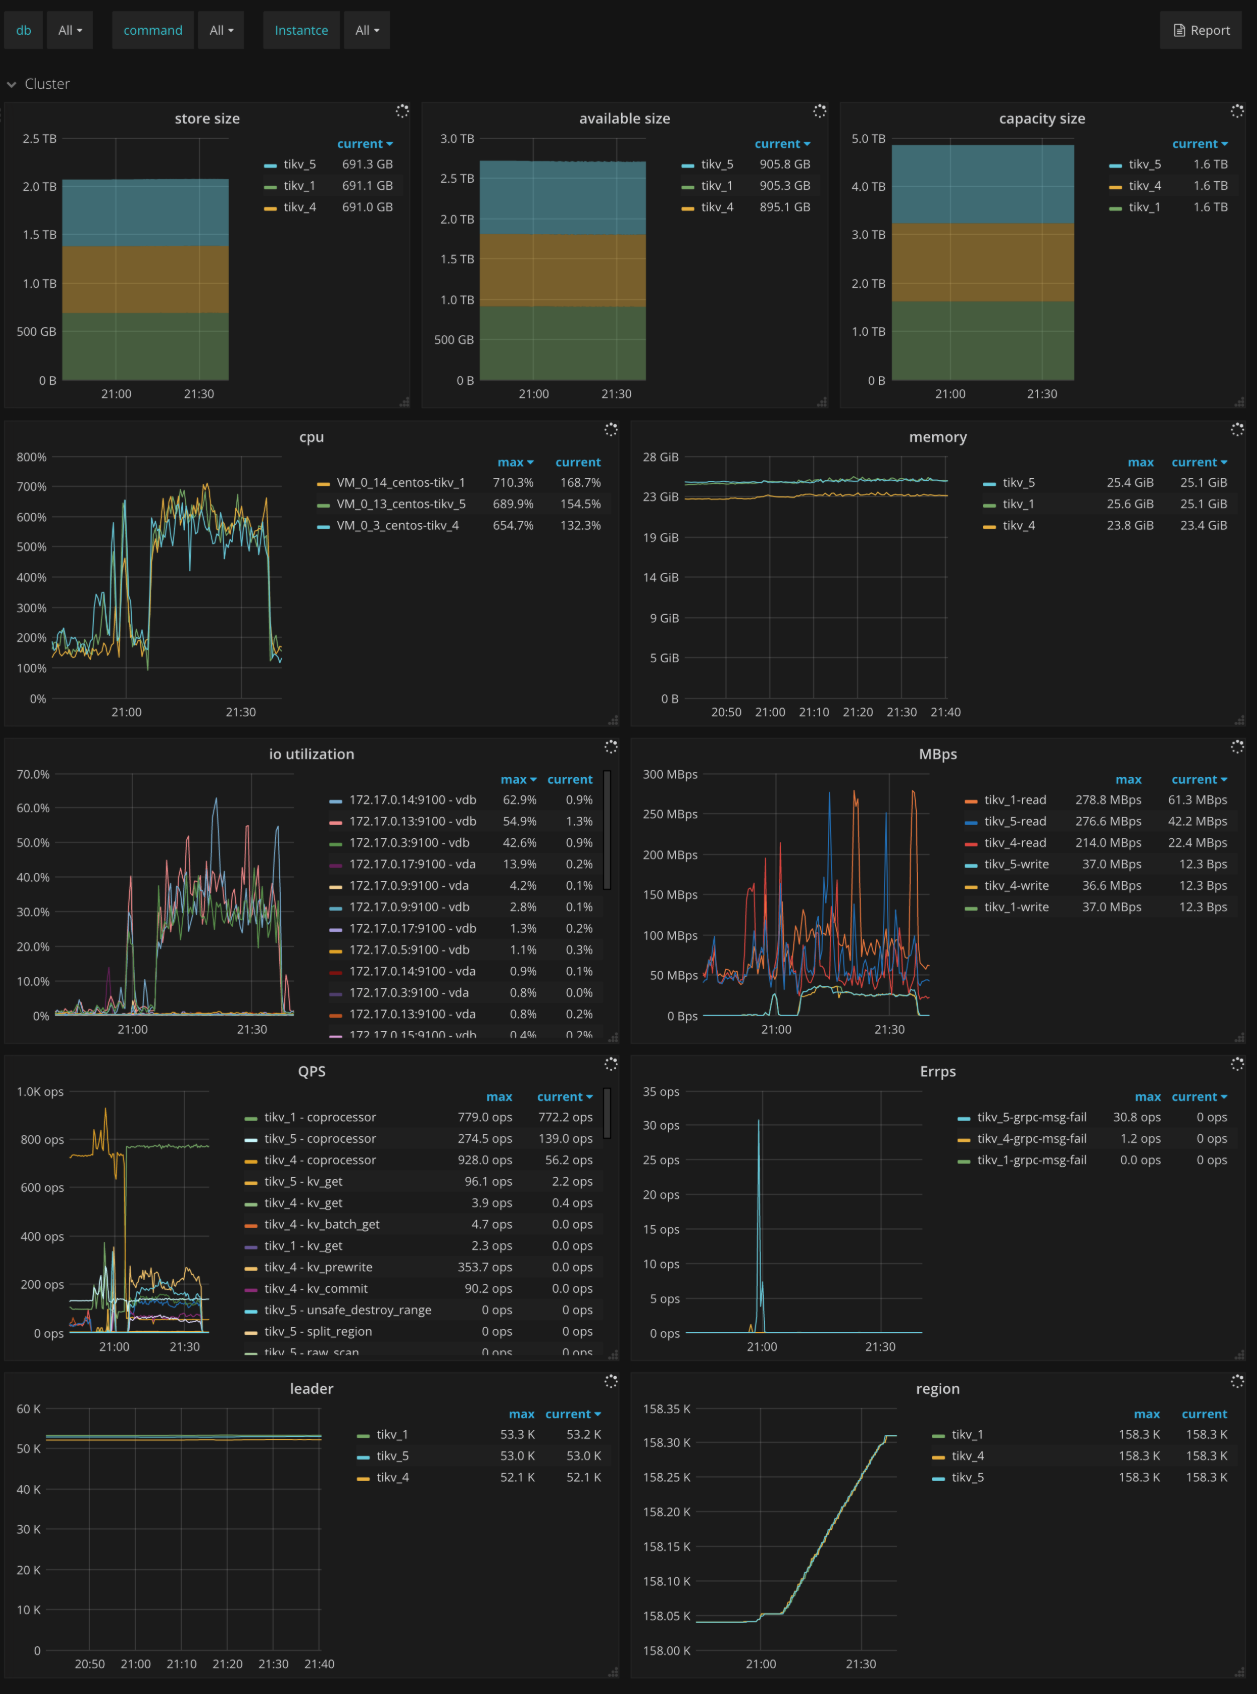
- Store size: The storage size per TiKV instance
- Available size: The available capacity per TiKV instance
- Capacity size: The capacity size per TiKV instance
- CPU: The CPU utilization per TiKV instance
- Memory: The memory usage per TiKV instance
- IO utilization: The I/O utilization per TiKV instance
- MBps: The total bytes of read and write in each TiKV instance
- QPS: The QPS per command in each TiKV instance
- Errps: The rate of gRPC message failures
- leader: The number of leaders per TiKV instance
- Region: The number of Regions per TiKV instance
- Uptime: The runtime of TiKV since last restart
Errors
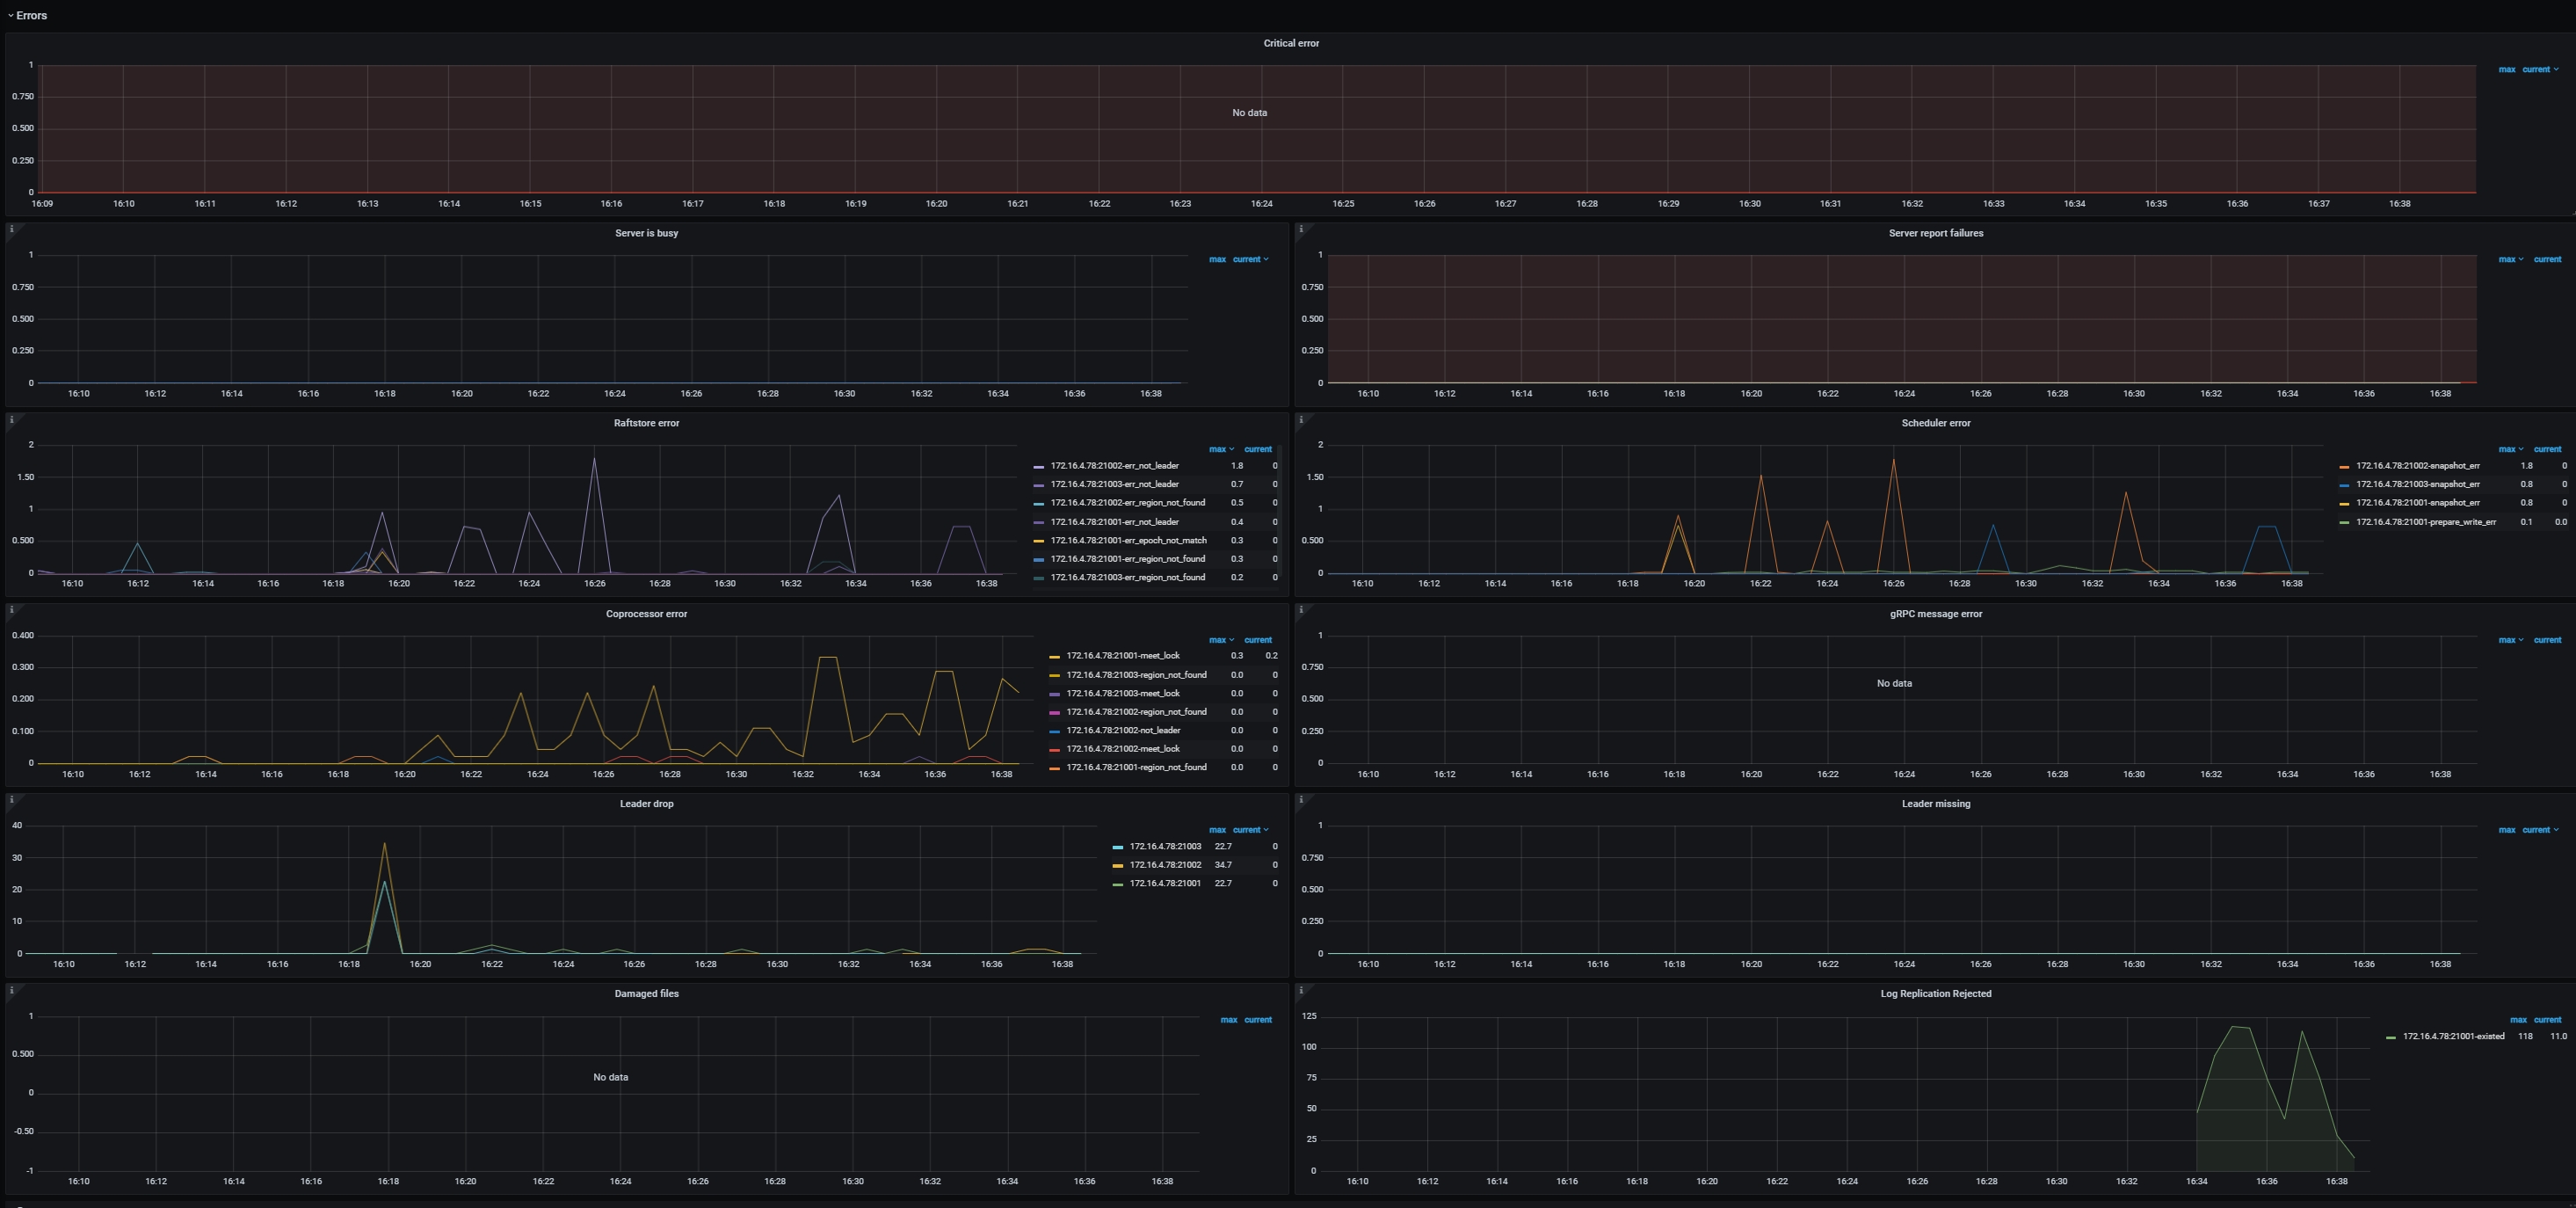
- Critical error: The number of critical errors
- Server is busy: Indicates occurrences of events that make the TiKV instance unavailable temporarily, such as Write Stall, and Channel Full. It should be
0in normal case. - Server report failures: The number of error messages reported by server. It should be
0in normal case. - Raftstore error: The number of Raftstore errors per type on each TiKV instance
- Scheduler error: The number of scheduler errors per type on each TiKV instance
- Coprocessor error: The number of coprocessor errors per type on each TiKV instance
- gRPC message error: The number of gRPC message errors per type on each TiKV instance
- Leader drop: The count of dropped leaders per TiKV instance
- Leader missing: The count of missing leaders per TiKV instance
- Log Replication Reject: The number of logappend messages rejected due to insufficient memory on each TiKV instance
Server
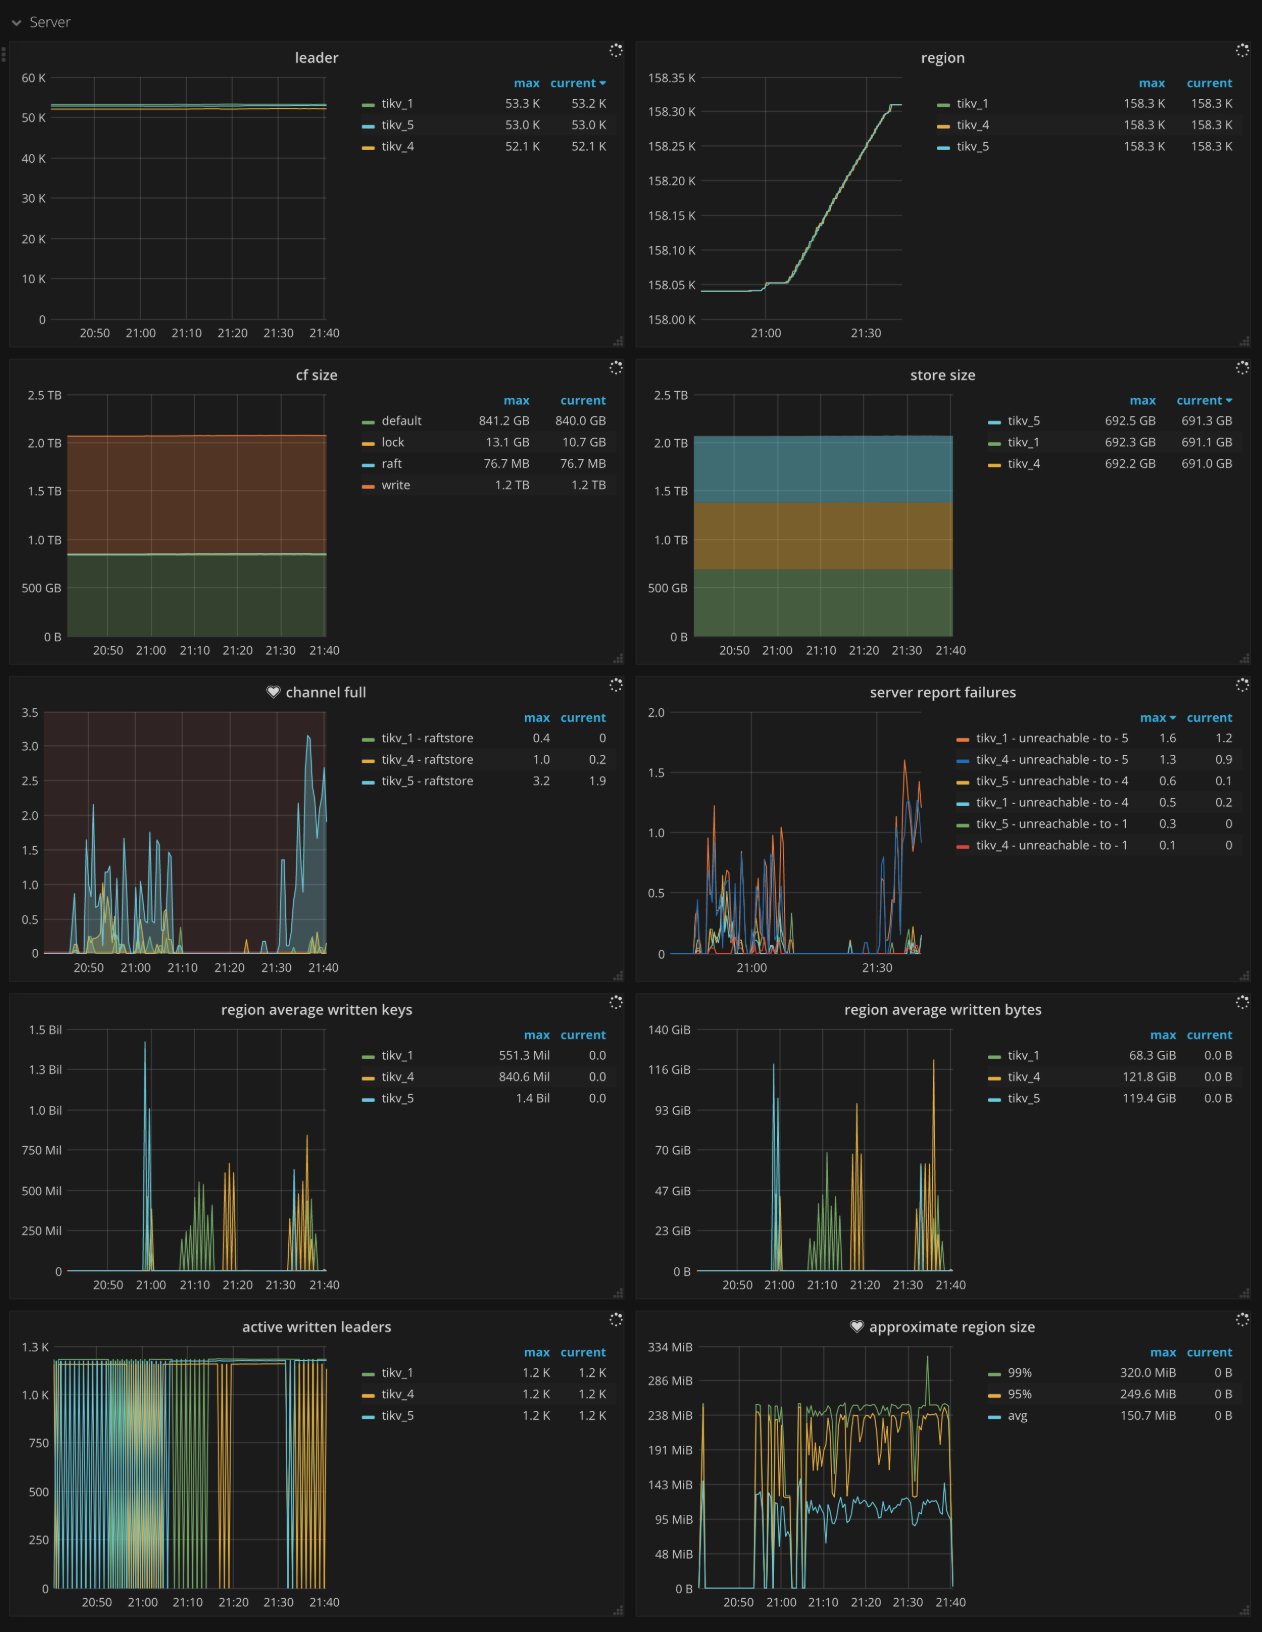
- CF size: The size of each column family
- Store size: The storage size per TiKV instance
- Channel full: The number of Channel Full errors per TiKV instance. It should be
0in normal case. - Active written leaders: The number of leaders being written on each TiKV instance
- Approximate Region size: The approximate Region size
- Approximate Region size Histogram: The histogram of each approximate Region size
- Region average written keys: The average number of written keys to Regions per TiKV instance
- Region average written bytes: The average written bytes to Regions per TiKV instance
gRPC
- gRPC message count: The rate of gRPC messages per type
- gRPC message failed: The rate of failed gRPC messages
- 99% gRPC message duration: The gRPC message duration per message type (P99)
- Average gRPC message duration: The average execution time of gRPC messages
- gRPC batch size: The batch size of gRPC messages between TiDB and TiKV
- Raft message batch size: The batch size of Raft messages between TiKV instances
- gRPC request sources QPS: The QPS of gRPC request sources
- gRPC request sources duration: The execution time of gRPC request sources
- gRPC resource group QPS: The QPS of gRPC request sources by resource groups
Thread CPU
- Raft store CPU: The CPU utilization of the
raftstorethread. The CPU utilization should be less than 80% *raftstore.store-pool-sizein normal case. - Async apply CPU: The CPU utilization of the
async applythread. The CPU utilization should be less than 90% *raftstore.apply-pool-sizein normal cases. - Store writer CPU: The CPU utilization of the async IO thread. The CPU utilization should be less than 90% *
raftstore.store-io-pool-sizein normal cases. - gRPC poll CPU: The CPU utilization of the
gRPCthread. The CPU utilization should be less than 80% *server.grpc-concurrencyin normal cases. - Scheduler worker CPU: The CPU utilization of the
scheduler workerthread. The CPU utilization should be less than 90% *storage.scheduler-worker-pool-sizein normal cases. - Storage ReadPool CPU: The CPU utilization of the
storage read poolthread - Unified read pool CPU: The CPU utilization of the
unified read poolthread - RocksDB CPU: The CPU utilization of the RocksDB thread
- Coprocessor CPU: The CPU utilization of the
coprocessorthread - GC worker CPU: The CPU utilization of the
GC workerthread - BackGround worker CPU: The CPU utilization of the
background workerthread - Import CPU: The CPU utilization of the
importthread - Backup Worker CPU: The CPU utilization of the
backupthread - CDC Worker CPU: The CPU utilization of the
CDC workerthread - CDC endpoint CPU: The CPU utilization of the
CDC endpointthread - Raftlog fetch worker CPU: The CPU utilization of the async raft log fetcher worker
- TSO Worker CPU: The CPU utilization of the
TSO workerthread
PD
- PD requests: The rate at which TiKV sends to PD
- PD request duration (average): The average duration of processing requests that TiKV sends to PD
- PD heartbeats: The rate at which heartbeat messages are sent from TiKV to PD
- PD validate peers: The rate at which messages are sent from TiKV to PD to validate TiKV peers
Raft IO
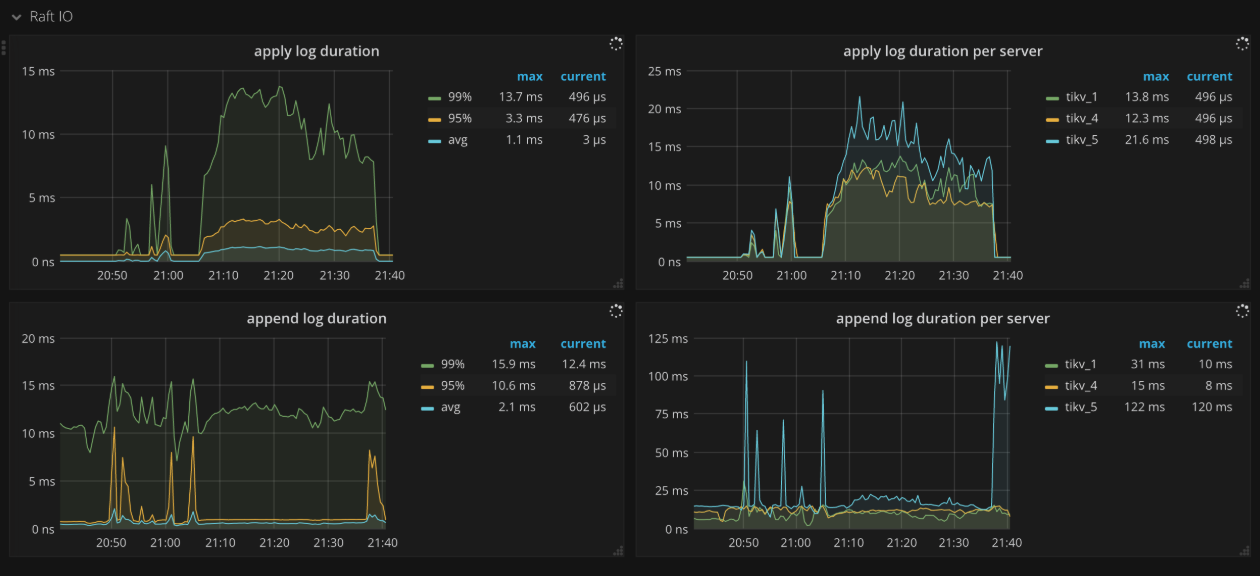
- Apply log duration: The time consumed for Raft to apply logs
- Apply log duration per server: The time consumed for Raft to apply logs per TiKV instance
- Append log duration: The time consumed for Raft to append logs
- Append log duration per server: The time consumed for Raft to append logs per TiKV instance
- Commit log duration: The time consumed by Raft to commit logs
- Commit log duration per server: The time consumed by Raft to commit logs per TiKV instance
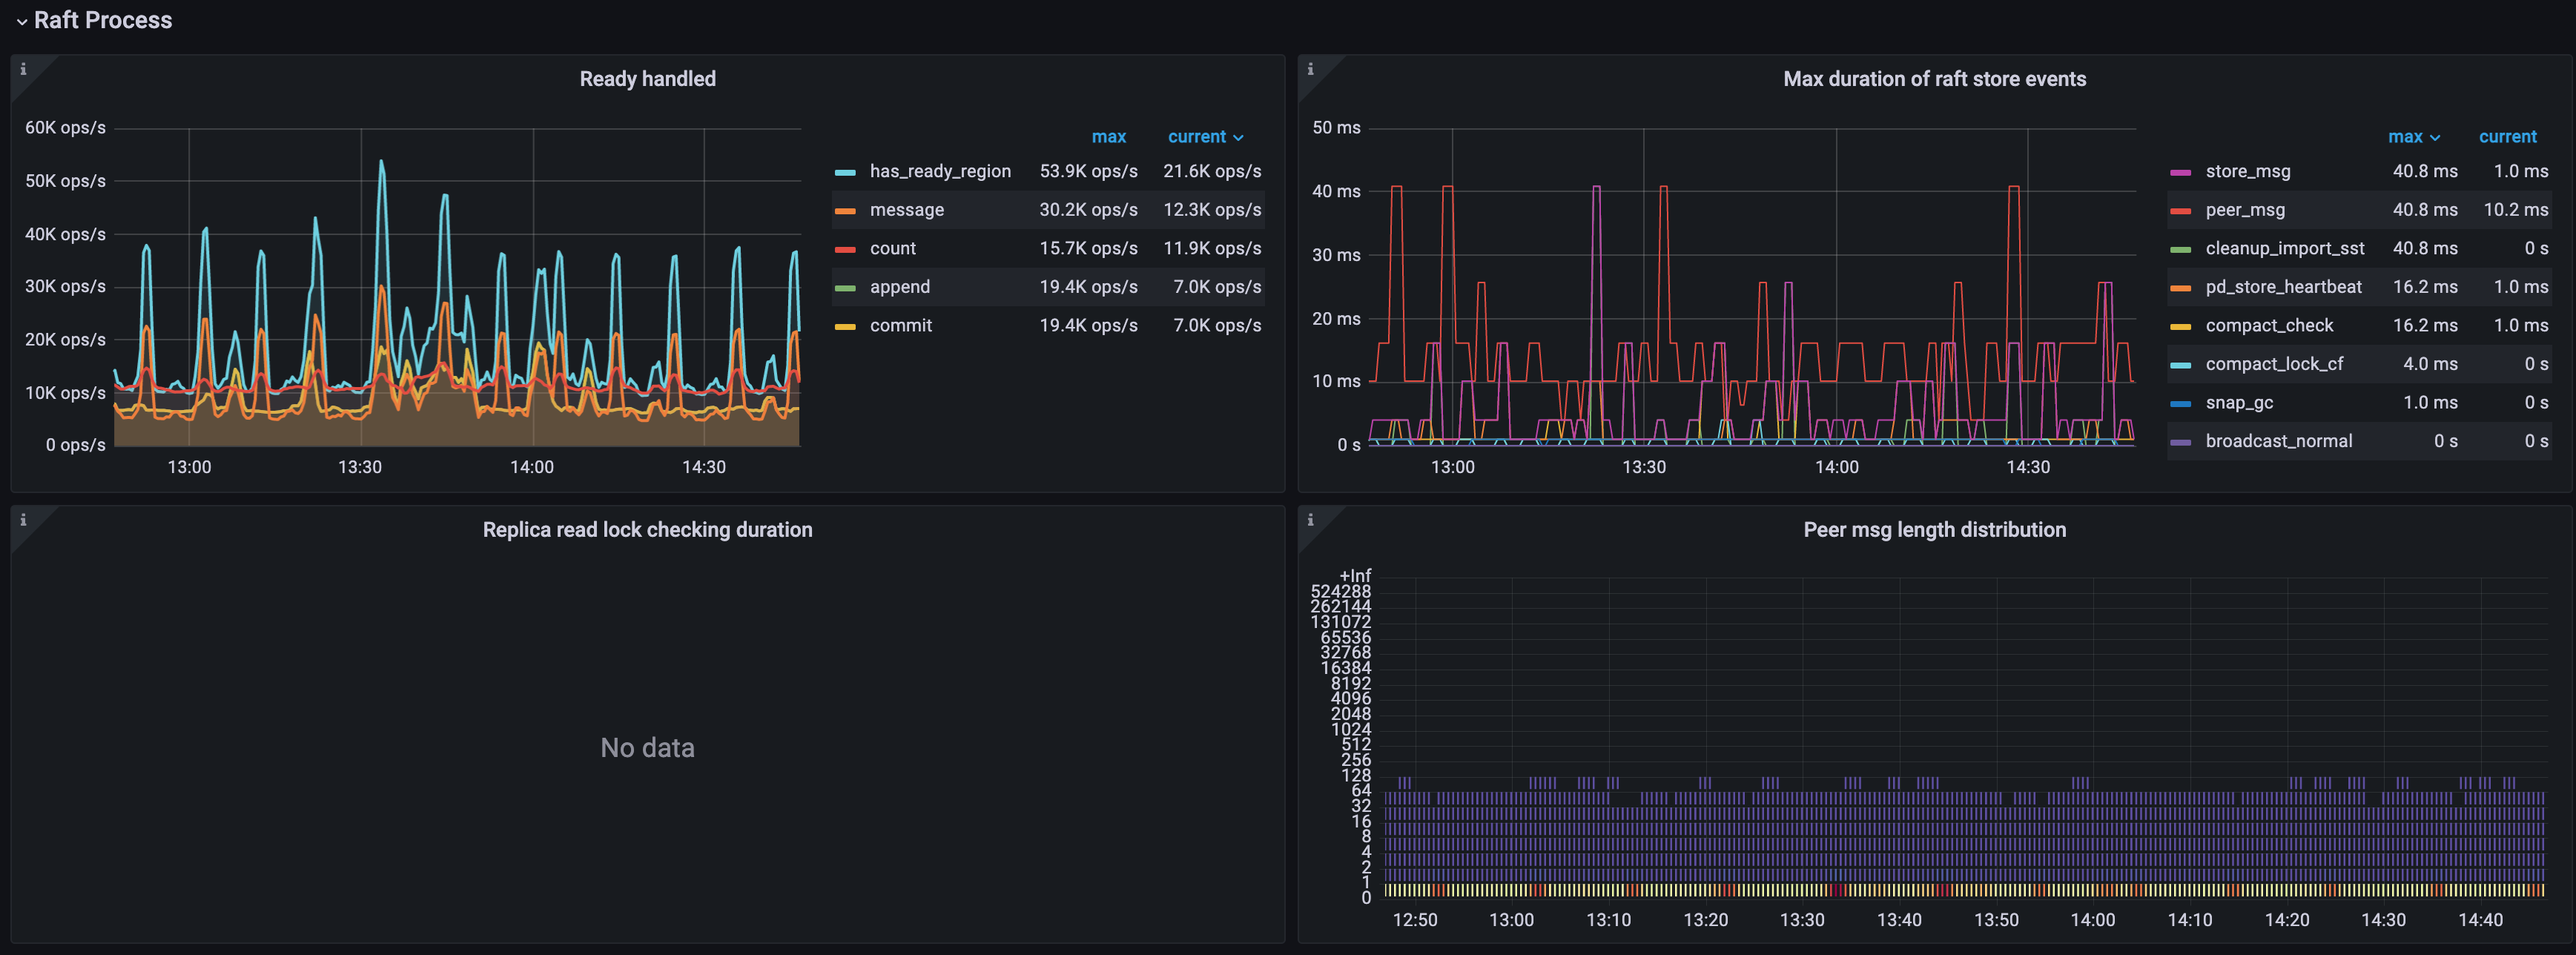
Raft process
- Ready handled: The number of handled ready operations per type per second
- count: The number of handled ready operations per second
- has_ready_region: The number of Regions that have ready per second
- pending_region: The operations per second of the Regions being checked for whether it has ready. This metric is deprecated since v3.0.0
- message: The number of messages that the ready operations per second contain
- append: The number of Raft log entries that the ready operations per second contain
- commit: The number of committed Raft log entries that the ready operations per second contain
- snapshot: The number of snapshots that the ready operations per second contains
- 0.99 Duration of Raft store events: The time consumed by Raftstore events (P99)
- Process ready duration: The time consumed for processes to be ready in Raft
- Process ready duration per server: The time consumed for peer processes to be ready in Raft per TiKV instance. It should be less than 2 seconds (P99.99).
- Max Duration of Raft store events: The time consumed by the slowest Raftstore event.
- Replica read lock checking duration: The time consumed for checking locks when processing Replica Read.
- Peer msg length distribution: The number of messages processed by each Region in each TiKV instance at a time. The more messages, the busier the peer is.
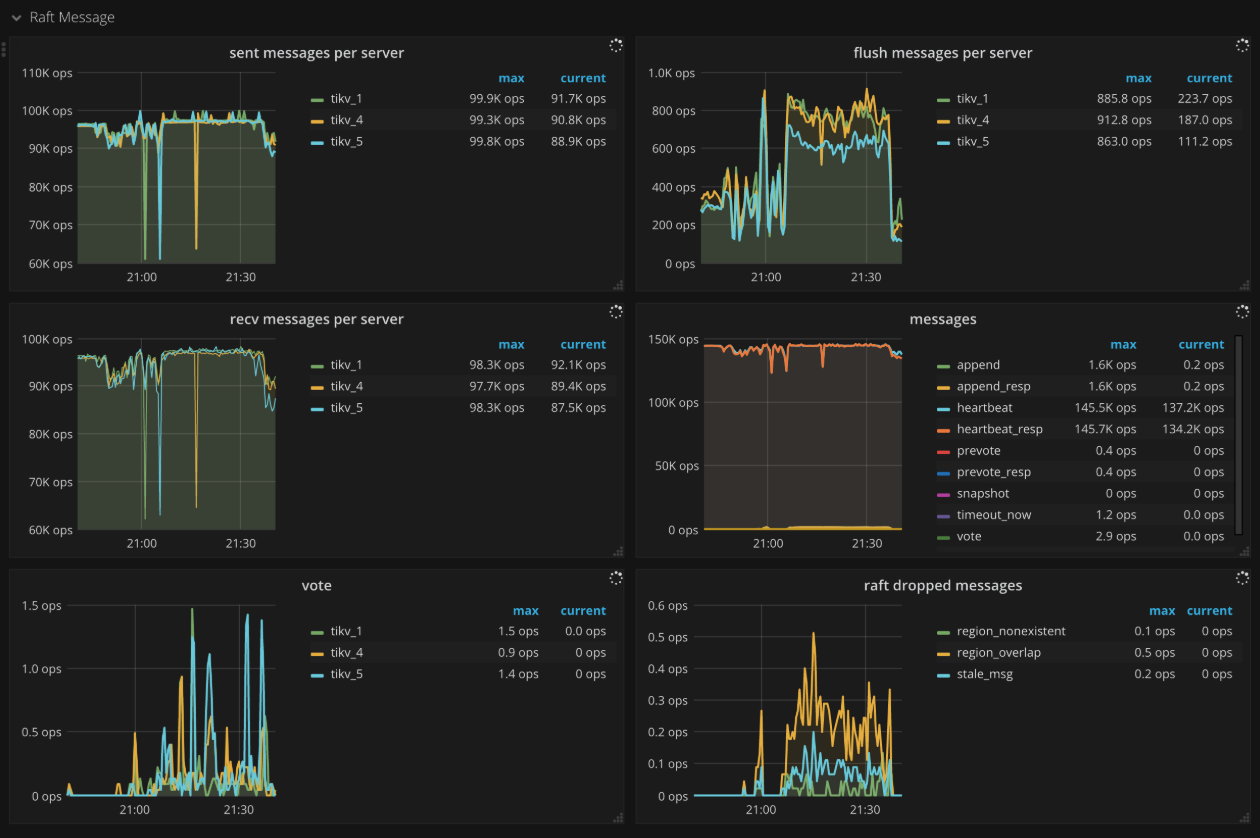
Raft message
- Sent messages per server: The number of Raft messages sent by each TiKV instance per second
- Flush messages per server: The number of Raft messages flushed by the Raft client in each TiKV instance per second
- Receive messages per server: The number of Raft messages received by each TiKV instance per second
- Messages: The number of Raft messages sent per type per second
- Vote: The number of Vote messages sent in Raft per second
- Raft dropped messages: The number of dropped Raft messages per type per second
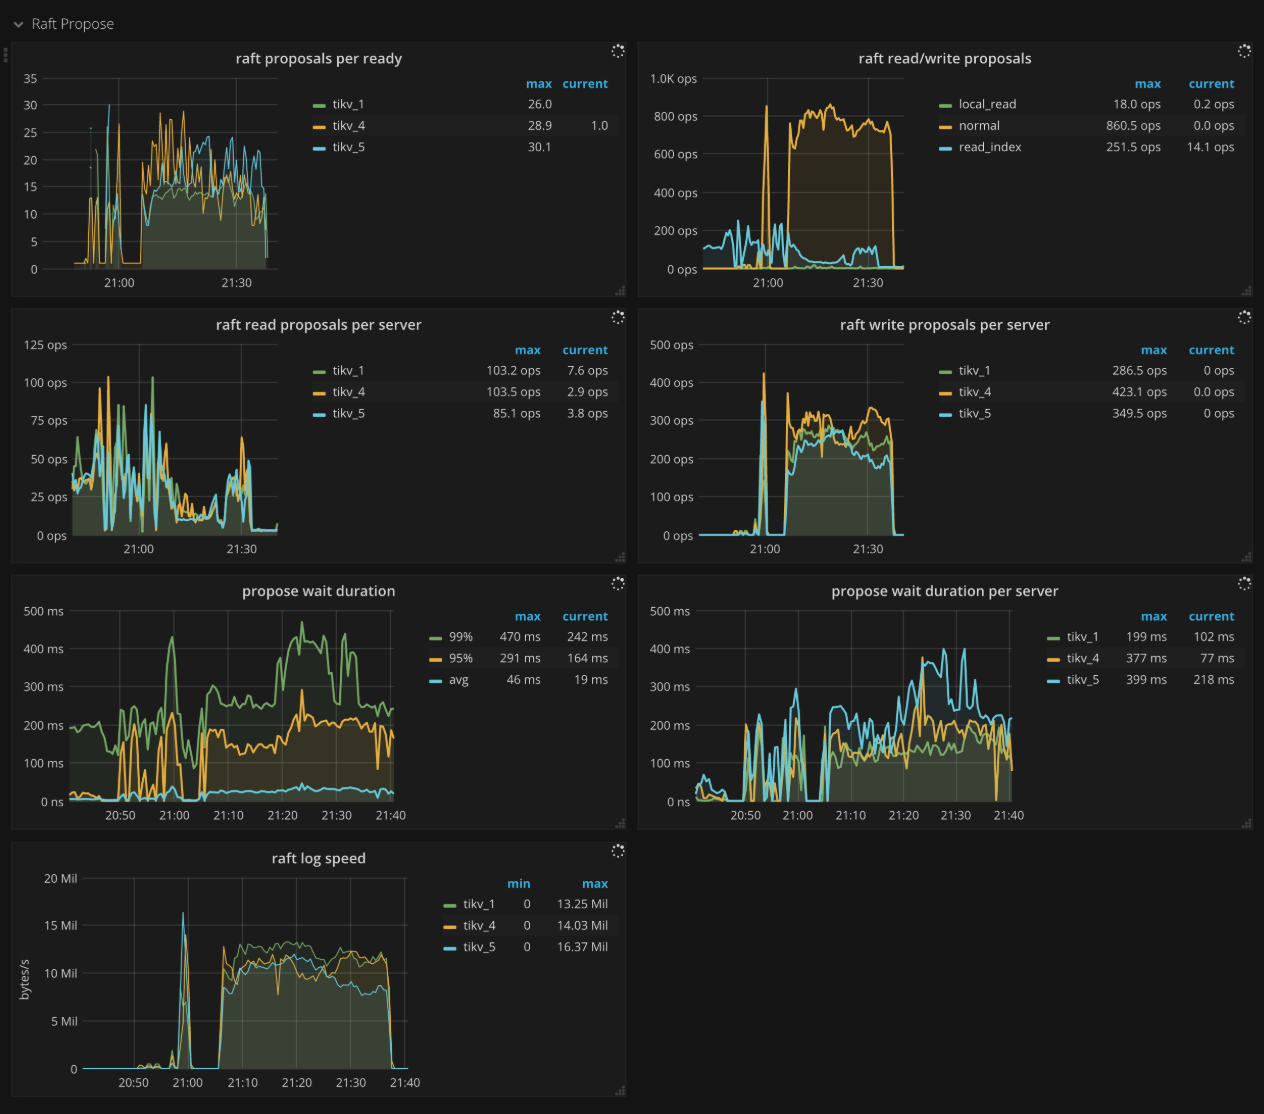
Raft propose
- Raft apply proposals per ready: The histogram of the number of proposals that each ready operation contains in a batch while applying proposal.
- Raft read/write proposals: The number of proposals per type per second
- Raft read proposals per server: The number of read proposals made by each TiKV instance per second
- Raft write proposals per server: The number of write proposals made by each TiKV instance per second
- Propose wait duration: The histogram of waiting time of each proposal
- Propose wait duration per server: The histogram of waiting time of each proposal per TiKV instance
- Apply wait duration: The histogram of apply time of each proposal
- Apply wait duration per server: The histogram of apply time of each proposal per TiKV instance
- Raft log speed: The average rate at which peers propose logs
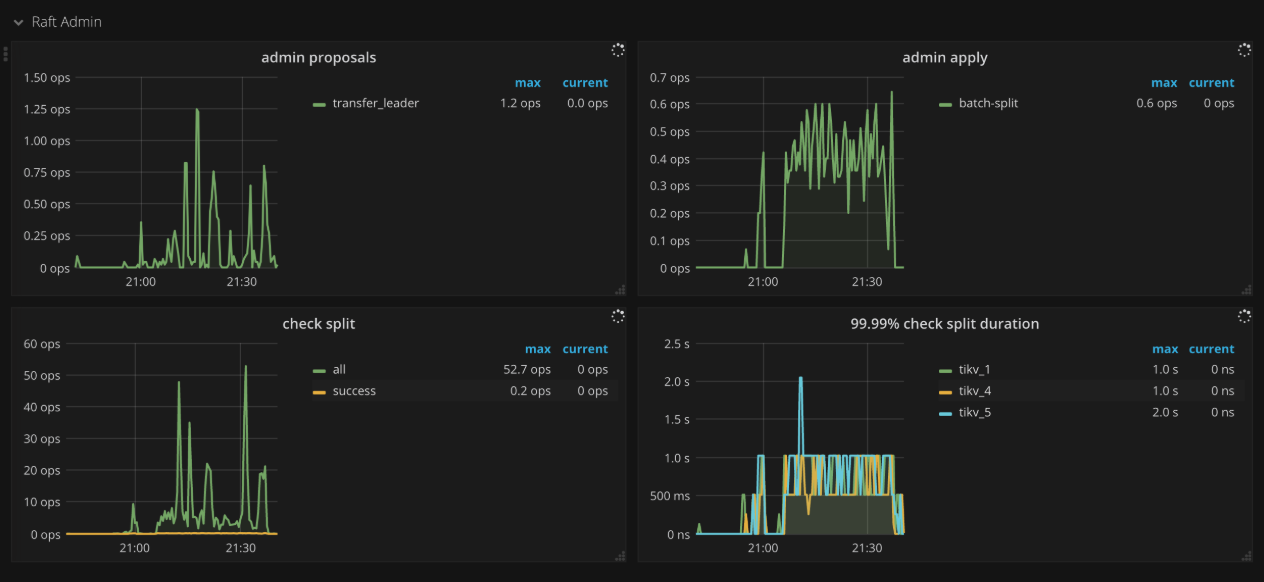
Raft admin
- Admin proposals: The number of admin proposals per second
- Admin apply: The number of processed apply commands per second
- Check split: The number of Raftstore split check commands per second
- 99.99% Check split duration: The time consumed when running split check commands (P99.99)
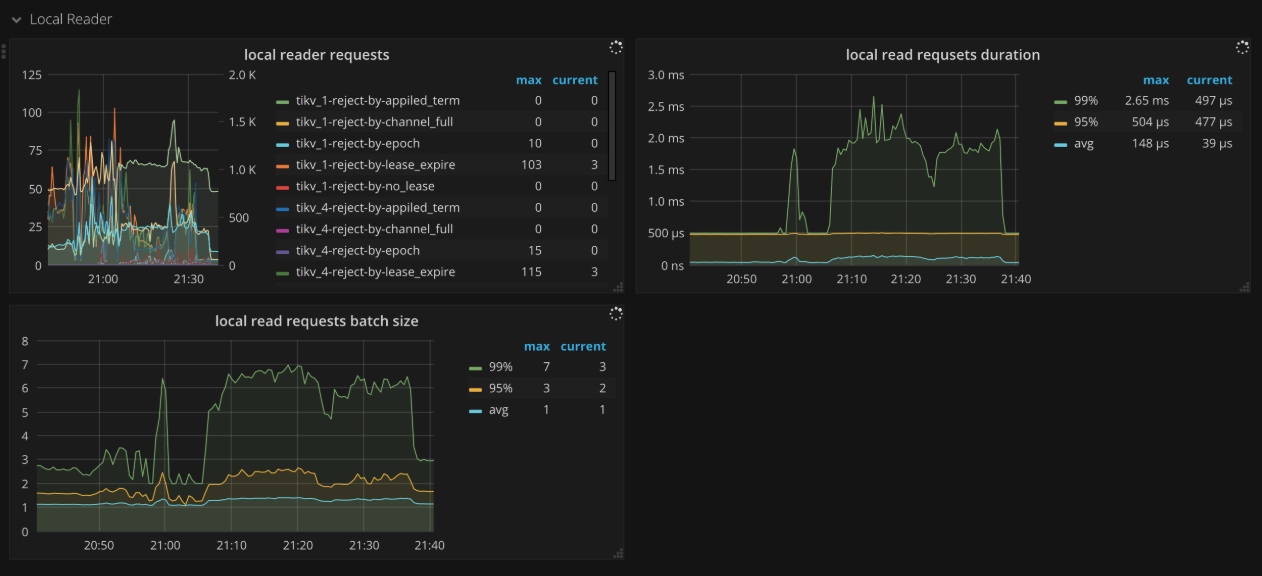
Local reader
- Local reader requests: The number of total requests and the number of rejections from the local read thread
Unified Read Pool
- Time used by level: The time consumed for each level in the unified read pool. Level 0 means small queries.
- Level 0 chance: The proportion of level 0 tasks in unified read pool
- Running tasks: The number of tasks running concurrently in the unified read pool
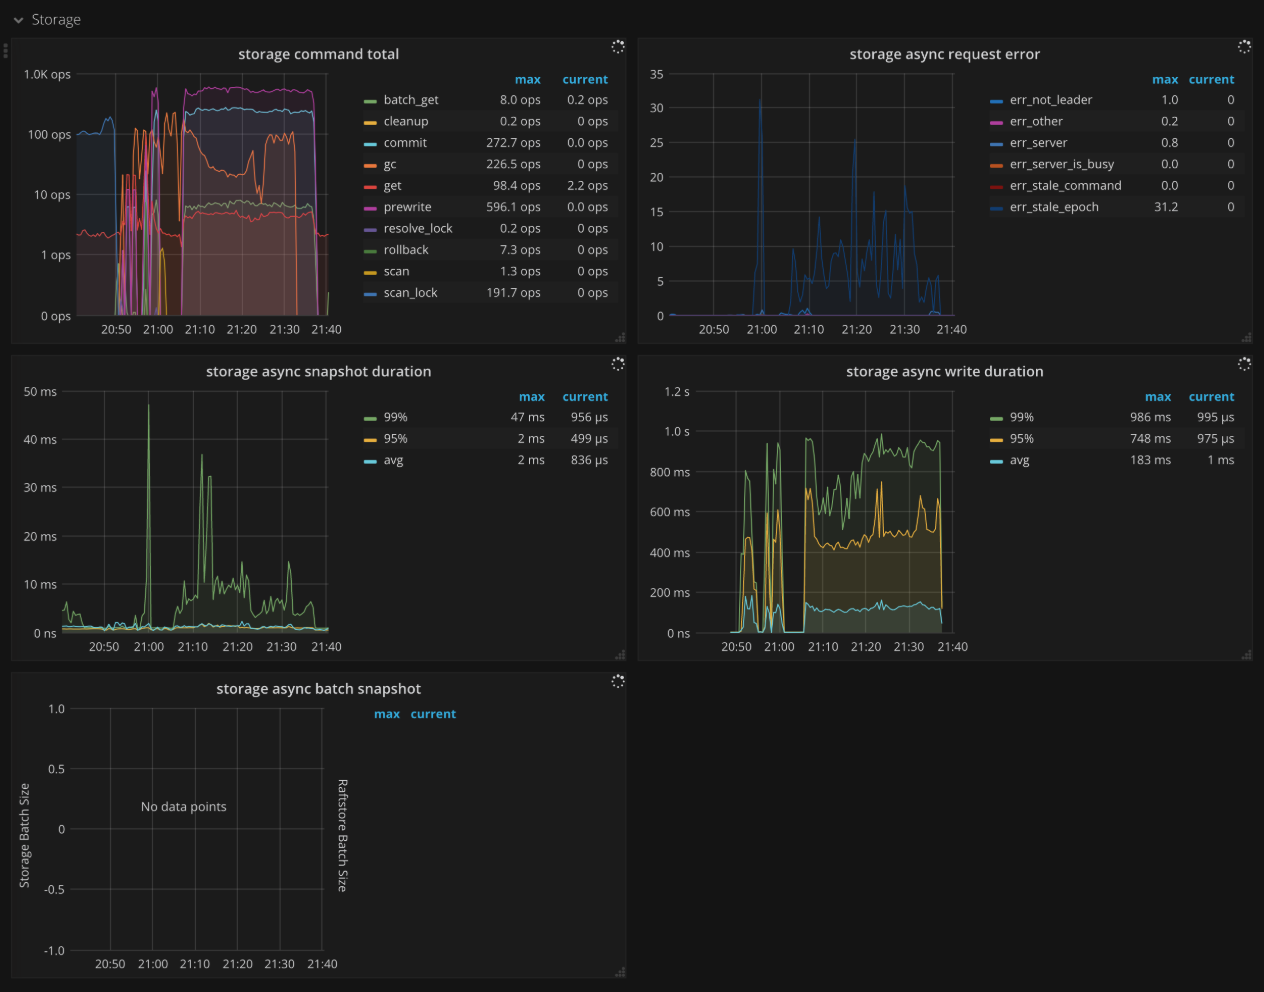
Storage
- Storage command total: The number of received command by type per second
- Storage async request error: The number of engine asynchronous request errors per second
- Storage async snapshot duration: The time consumed by processing asynchronous snapshot requests. It should be less than
1sin.99. - Storage async write duration: The time consumed by processing asynchronous write requests. It should be less than
1sin.99.
Flow Control
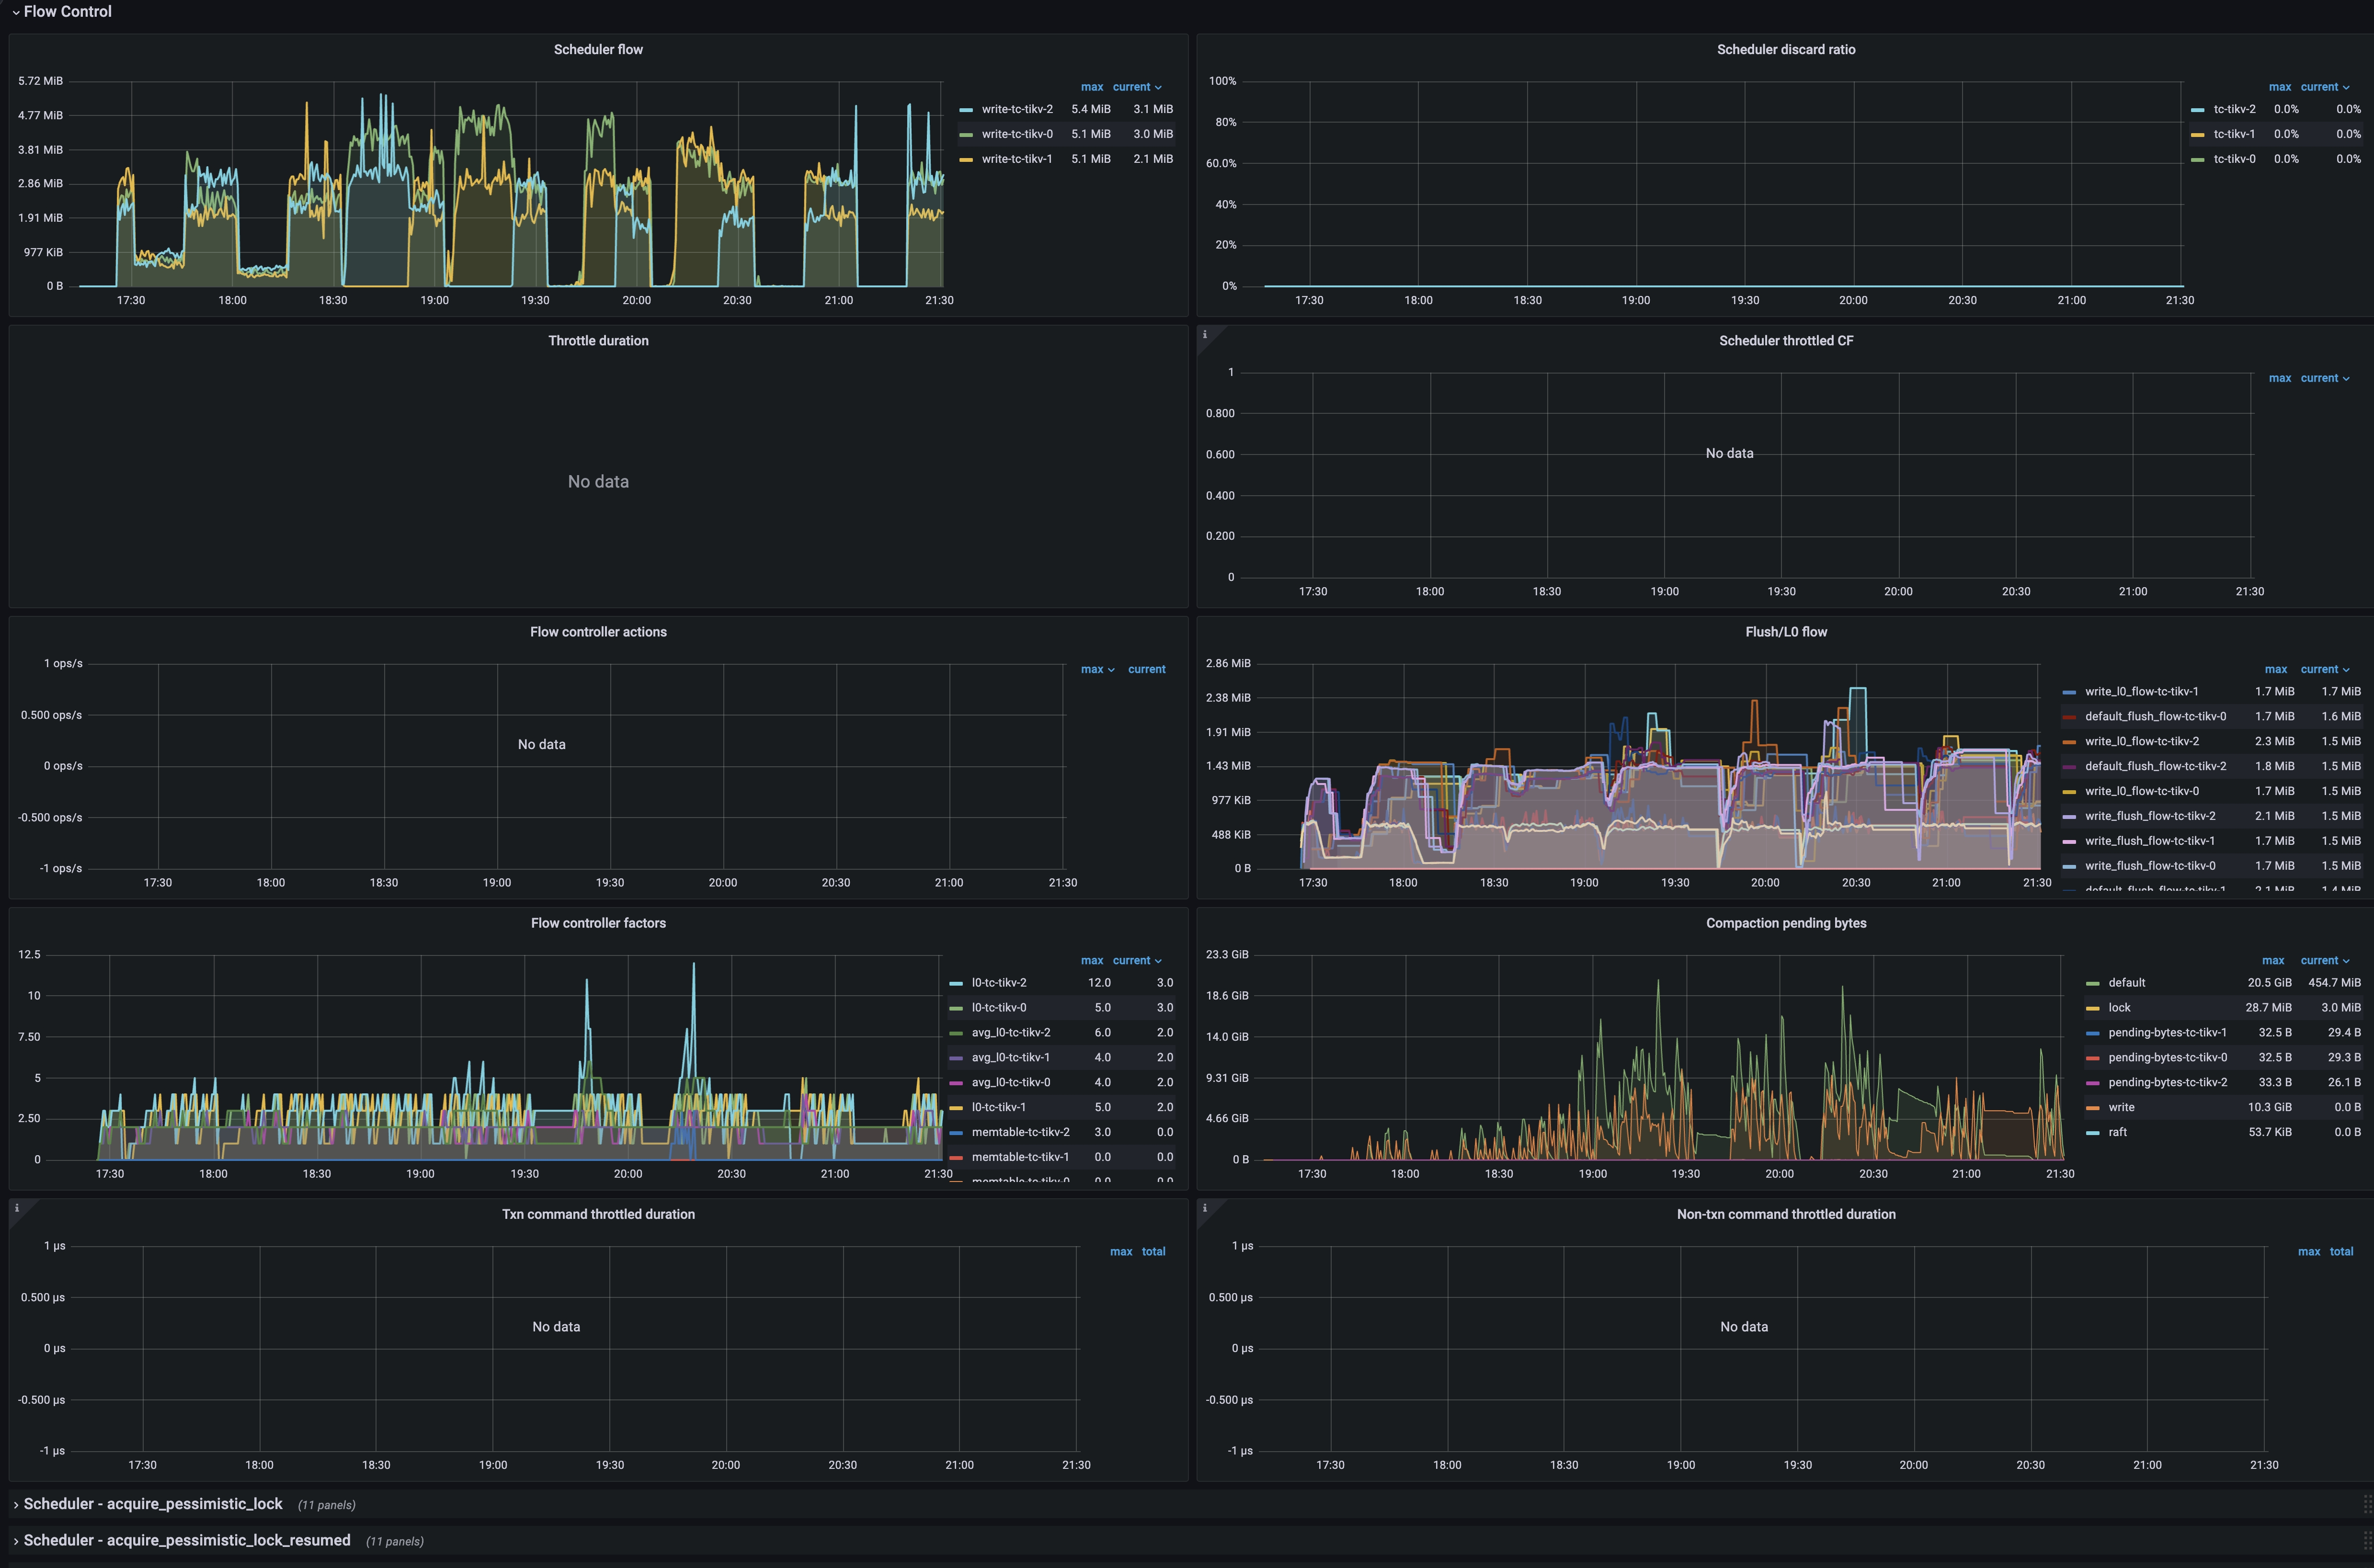
- Scheduler flow: The scheduler traffic on each TiKV instance in real time.
- Scheduler discard ratio: The rejection ratio of scheduler requests on each TiKV instance. If this ratio is greater than 0, it indicates that flow control exists. When
Compaction pending bytesexceeds its threshold, TiKV will linearly increase theScheduler discard ratiobased on the exceeded portion. The client will retry the rejected requests automatically. - Throttle duration: The blocked duration for the execution of the scheduler requests when flow control is triggered due to too many L0 files. If this metric has values, it indicates that flow control exists.
- Scheduler throttled CF: The CF that triggers RocksDB throttling when the flow control threshold is reached.
- Flow controller actions: The actions that trigger RocksDB throttling when the flow control threshold is reached.
- Flush/L0 flow: The traffic of flush and L0 compaction for different CFs of RocksDB on each TiKV instance.
- Flow control factors: The factors related to triggering RocksDB throttling.
- Compaction pending bytes: The size of the RocksDB data awaiting compaction in real time on each TiKV instance.
- Txn command throttled duration: The blocked duration for commands related to transactions due to throttling. Under normal circumstances, this metric is 0.
- Non-txn command throttled duration: The blocked duration for other commands due to throttling. Under normal circumstances, this metric is 0.
Scheduler
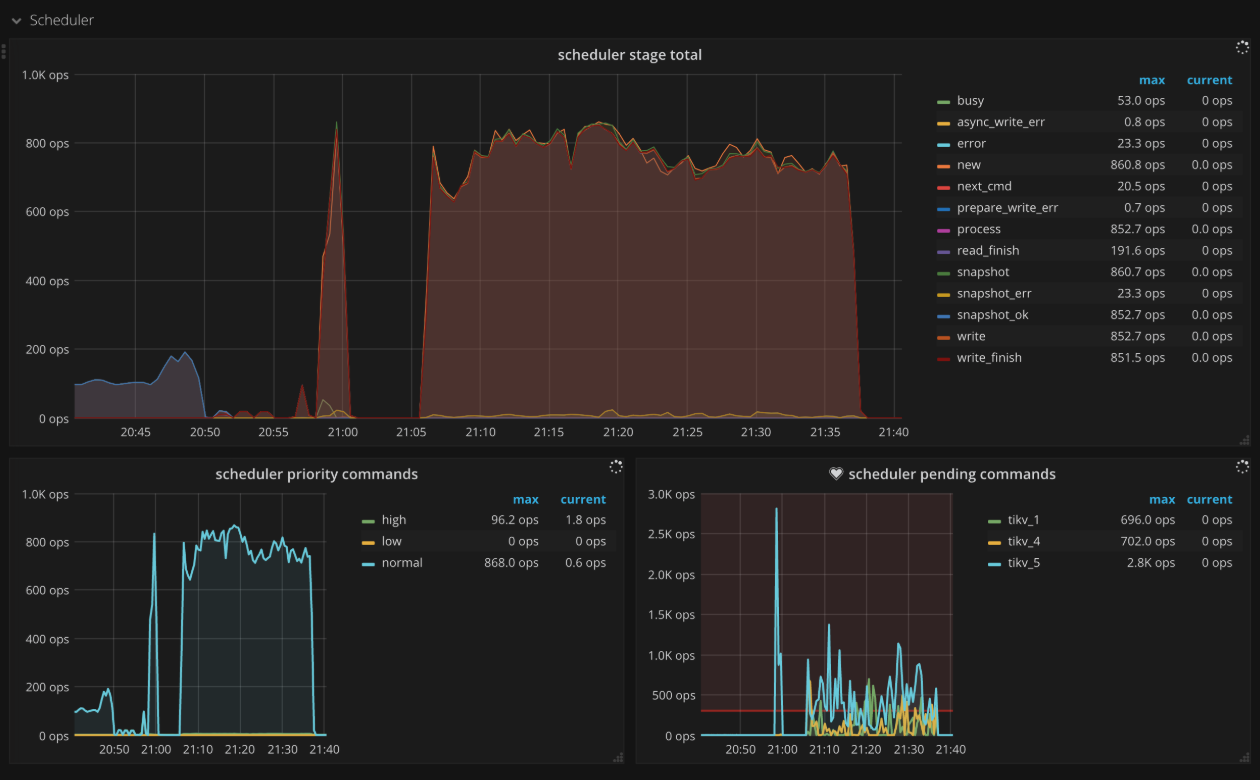
- Scheduler stage total: The number of commands at each stage per second. There should not be a lot of errors in a short time.
- Scheduler writing bytes: The total written bytes by commands processed on each TiKV instance
- Scheduler priority commands: The count of different priority commands per second
- Scheduler pending commands: The count of pending commands per TiKV instance per second
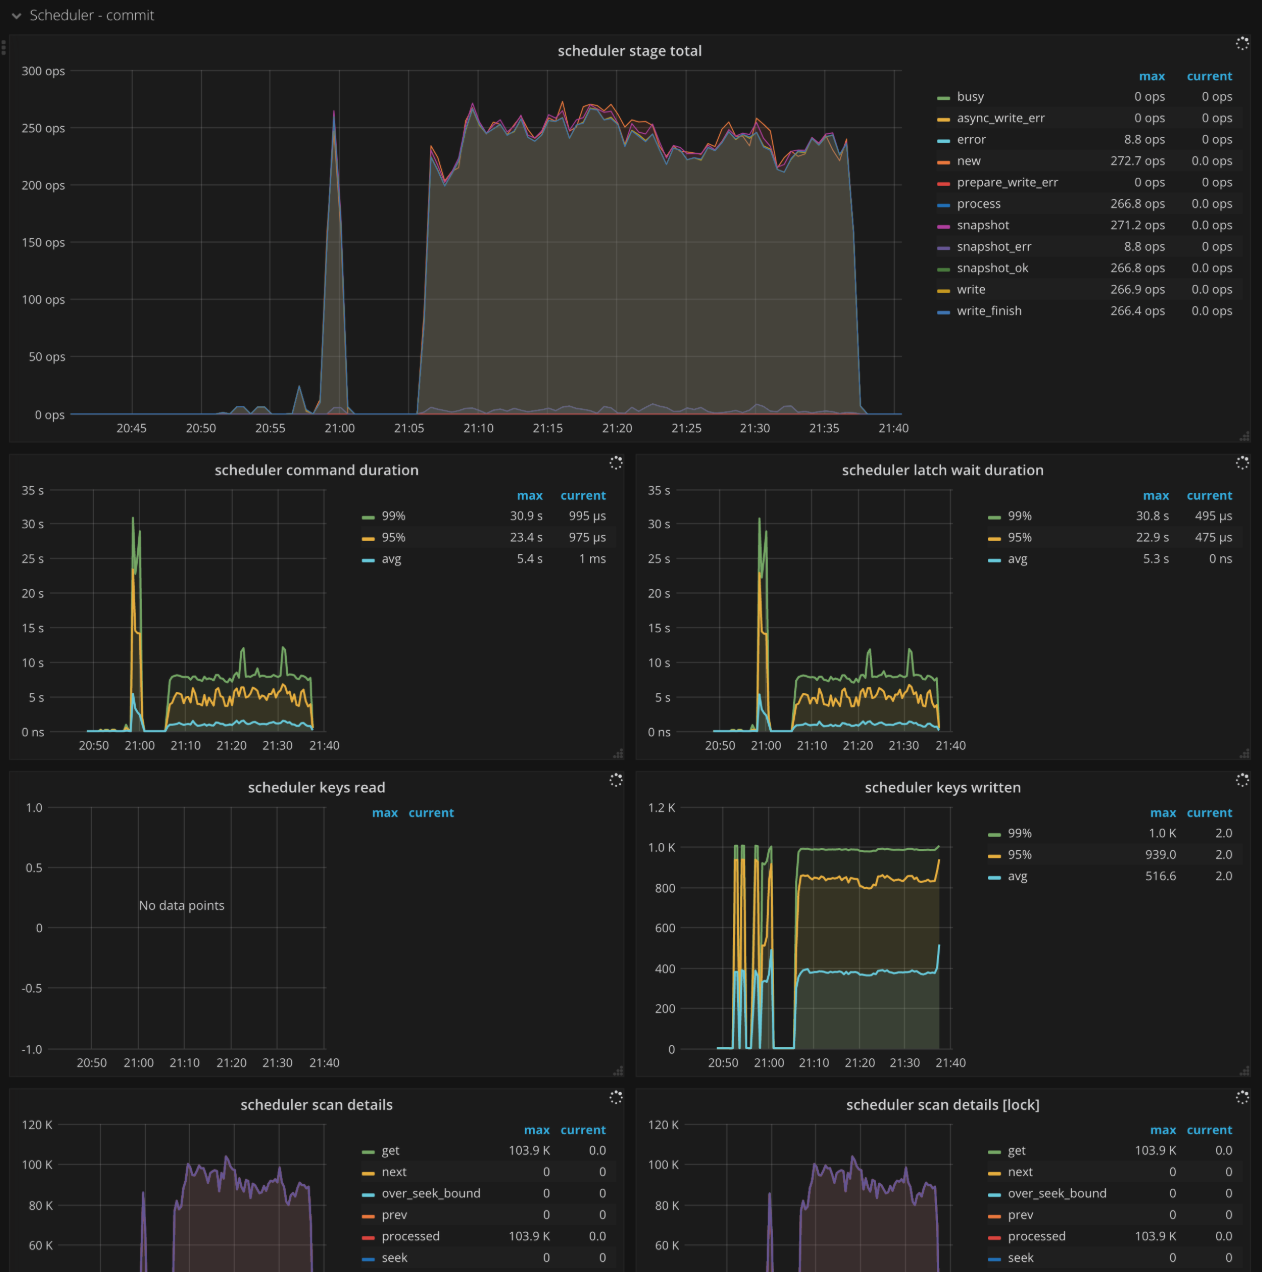
Scheduler - commit
- Scheduler stage total: The number of commands at each stage per second when executing the commit command. There should not be a lot of errors in a short time.
- Scheduler command duration: The time consumed when executing the commit command. It should be less than
1s. - Scheduler latch wait duration: The waiting time caused by latch when executing the commit command. It should be less than
1s. - Scheduler keys read: The count of keys read by a commit command
- Scheduler keys written: The count of keys written by a commit command
- Scheduler scan details: The keys scan details of each CF when executing the commit command.
- Scheduler scan details [lock]: The keys scan details of lock CF when executing the commit command
- Scheduler scan details [write]: The keys scan details of write CF when executing the commit command
- Scheduler scan details [default]: The keys scan details of default CF when executing the commit command
Scheduler - pessimistic_rollback
- Scheduler stage total: The number of commands at each stage per second when executing the
pessimistic_rollbackcommand. There should not be a lot of errors in a short time. - Scheduler command duration: The time consumed when executing the
pessimistic_rollbackcommand. It should be less than1s. - Scheduler latch wait duration: The waiting time caused by latch when executing the
pessimistic_rollbackcommand. It should be less than1s. - Scheduler keys read: The count of keys read by a
pessimistic_rollbackcommand - Scheduler keys written: The count of keys written by a
pessimistic_rollbackcommand - Scheduler scan details: The keys scan details of each CF when executing the
pessimistic_rollbackcommand. - Scheduler scan details [lock]: The keys scan details of lock CF when executing the
pessimistic_rollbackcommand - Scheduler scan details [write]: The keys scan details of write CF when executing the
pessimistic_rollbackcommand - Scheduler scan details [default]: The keys scan details of default CF when executing the
pessimistic_rollbackcommand
Scheduler - prewrite
- Scheduler stage total: The number of commands at each stage per second when executing the prewrite command. There should not be a lot of errors in a short time.
- Scheduler command duration: The time consumed when executing the prewrite command. It should be less than
1s. - Scheduler latch wait duration: The waiting time caused by latch when executing the prewrite command. It should be less than
1s. - Scheduler keys read: The count of keys read by a prewrite command
- Scheduler keys written: The count of keys written by a prewrite command
- Scheduler scan details: The keys scan details of each CF when executing the prewrite command.
- Scheduler scan details [lock]: The keys scan details of lock CF when executing the prewrite command
- Scheduler scan details [write]: The keys scan details of write CF when executing the prewrite command
- Scheduler scan details [default]: The keys scan details of default CF when executing the prewrite command
Scheduler - rollback
- Scheduler stage total: The number of commands at each stage per second when executing the rollback command. There should not be a lot of errors in a short time.
- Scheduler command duration: The time consumed when executing the rollback command. It should be less than
1s. - Scheduler latch wait duration: The waiting time caused by latch when executing the rollback command. It should be less than
1s. - Scheduler keys read: The count of keys read by a rollback command
- Scheduler keys written: The count of keys written by a rollback command
- Scheduler scan details: The keys scan details of each CF when executing the rollback command.
- Scheduler scan details [lock]: The keys scan details of lock CF when executing the rollback command
- Scheduler scan details [write]: The keys scan details of write CF when executing the rollback command
- Scheduler scan details [default]: The keys scan details of default CF when executing the rollback command
GC
- GC tasks: The count of GC tasks processed by gc_worker
- GC tasks Duration: The time consumed when executing GC tasks
- TiDB GC seconds: The GC duration
- TiDB GC worker actions: The count of TiDB GC worker actions
- ResolveLocks Progress: The progress of the first phase of GC (Resolve Locks)
- TiKV Auto GC Progress: The progress of the second phase of GC
- GC speed: The number of keys deleted by GC per second
- TiKV Auto GC SafePoint: The value of TiKV GC safe point. The safe point is the current GC timestamp
- GC lifetime: The lifetime of TiDB GC
- GC interval: The interval of TiDB GC
- GC in Compaction Filter: The count of filtered versions in the compaction filter of write CF.
Snapshot
- Rate snapshot message: The rate at which Raft snapshot messages are sent
- 99% Handle snapshot duration: The time consumed to handle snapshots (P99)
- Snapshot state count: The number of snapshots per state
- 99.99% Snapshot size: The snapshot size (P99.99)
- 99.99% Snapshot KV count: The number of KV within a snapshot (P99.99)
Task
- Worker handled tasks: The number of tasks handled by worker per second
- Worker pending tasks: Current number of pending and running tasks of worker per second. It should be less than
1000in normal case. - FuturePool handled tasks: The number of tasks handled by future pool per second
- FuturePool pending tasks: Current number of pending and running tasks of future pool per second
Coprocessor Overview
- Request duration: The total duration from the time of receiving the coprocessor request to the time of finishing processing the request
- Total Requests: The number of requests by type per second
- Handle duration: The histogram of time spent actually processing coprocessor requests per minute
- Total Request Errors: The number of request errors of Coprocessor per second. There should not be a lot of errors in a short time.
- Total KV Cursor Operations: The total number of the KV cursor operations by type per second, such as
select,index,analyze_table,analyze_index,checksum_table, andchecksum_index. - KV Cursor Operations: The histogram of KV cursor operations by type per second
- Total RocksDB Perf Statistics: The statistics of RocksDB performance
- Total Response Size: The total size of coprocessor response
Coprocessor Detail
- Handle duration: The histogram of time spent actually processing coprocessor requests per minute
- 95% Handle duration by store: The time consumed to handle coprocessor requests per TiKV instance per second (P95)
- Wait duration: The time consumed when coprocessor requests are waiting to be handled. It should be less than
10s(P99.99). - 95% Wait duration by store: The time consumed when coprocessor requests are waiting to be handled per TiKV instance per second (P95)
- Total DAG Requests: The total number of DAG requests per second
- Total DAG Executors: The total number of DAG executors per second
- Total Ops Details (Table Scan): The number of RocksDB internal operations per second when executing select scan in coprocessor
- Total Ops Details (Index Scan): The number of RocksDB internal operations per second when executing index scan in coprocessor
- Total Ops Details by CF (Table Scan): The number of RocksDB internal operations for each CF per second when executing select scan in coprocessor
- Total Ops Details by CF (Index Scan): The number of RocksDB internal operations for each CF per second when executing index scan in coprocessor
Threads
- Threads state: The state of TiKV threads
- Threads IO: The I/O traffic of each TiKV thread
- Thread Voluntary Context Switches: The number of TiKV threads voluntary context switches
- Thread Nonvoluntary Context Switches: The number of TiKV threads nonvoluntary context switches
RocksDB - kv/raft
- Get operations: The count of get operations per second
- Get duration: The time consumed when executing get operations
- Seek operations: The count of seek operations per second
- Seek duration: The time consumed when executing seek operations
- Write operations: The count of write operations per second
- Write duration: The time consumed when executing write operations
- WAL sync operations: The count of WAL sync operations per second
- Write WAL duration: The time consumed for writing WAL
- WAL sync duration: The time consumed when executing WAL sync operations
- Compaction operations: The count of compaction and flush operations per second
- Compaction duration: The time consumed when executing the compaction and flush operations
- SST read duration: The time consumed when reading SST files
- Write stall duration: Write stall duration. It should be
0in normal case. - Memtable size: The memtable size of each column family
- Memtable hit: The hit rate of memtable
- Block cache size: The block cache size. Broken down by column family if shared block cache is disabled.
- Block cache hit: The hit rate of block cache
- Block cache flow: The flow rate of block cache operations per type
- Block cache operations: The count of block cache operations per type
- Keys flow: The flow rate of operations on keys per type
- Total keys: The count of keys in each column family
- Read flow: The flow rate of read operations per type
- Bytes / Read: The bytes per read operation
- Write flow: The flow rate of write operations per type
- Bytes / Write: The bytes per write operation
- Compaction flow: The flow rate of compaction operations per type
- Compaction pending bytes: The pending bytes to be compacted
- Read amplification: The read amplification per TiKV instance
- Compression ratio: The compression ratio of each level
- Number of snapshots: The number of snapshots per TiKV instance
- Oldest snapshots duration: The time that the oldest unreleased snapshot survivals
- Number files at each level: The number of SST files for different column families in each level
- Ingest SST duration seconds: The time consumed to ingest SST files
- Stall conditions changed of each CF: Stall conditions changed of each column family
Raft Engine
- Operations
- write: the number of write operations by Raft Engine per second
- read_entry: the number of raft log read operations by Raft Engine per second
- read_message: the number of raft metadata read operations by Raft Engine per second
- Write duration: the duration of write operations by Raft Engine. This duration is close to the sum of the latency of disk IOs involved in writing these data.
- Flow
- write: the write traffic of Raft Engine
- rewrite append: the traffic of rewriting append logs
- rewrite rewrite: the traffic of rewriting rewrite logs
- Write Duration Breakdown (99%)
- wal: the latency of writing Raft Engine WAL
- wait: the waiting time before writing
- apply: the time consumed for applying data to memory
- Bytes/Written: the bytes written by Raft Engine every time
- WAL Duration Breakdown (P99%): the time consumed for each stage of writing Raft Engine WAL
- File Count
- append: the number of files used for appending data by Raft Engine
- rewrite: the number of files used for rewriting data by Raft Engine (rewrite is similar to RocksDB compaction)
- Entry Count
- rewrite: the number of entries rewritten by Raft Engine
- append: the number of entries appended by Raft Engine
Titan - All
- Blob file count: The number of Titan blob files
- Blob file size: The total size of Titan blob file
- Live blob size: The total size of valid blob record
- Blob cache hit: The hit rate of Titan block cache
- Iter touched blob file count: The number of blob file involved in a single iterator
- Blob file discardable ratio distribution: The ratio distribution of blob record failure of blob files
- Blob key size: The size of Titan blob keys
- Blob value size: The size of Titan blob values
- Blob get operations: The count of get operations in Titan blob
- Blob get duration: The time consumed when executing get operations in Titan blob
- Blob iter operations: The time consumed when executing iter operations in Titan blob
- Blob seek duration: The time consumed when executing seek operations in Titan blob
- Blob next duration: The time consumed when executing next operations in Titan blob
- Blob prev duration: The time consumed when executing prev operations in Titan blob
- Blob keys flow: The flow rate of operations on Titan blob keys
- Blob bytes flow: The flow rate of bytes on Titan blob keys
- Blob file read duration: The time consumed when reading Titan blob file
- Blob file write duration: The time consumed when writing Titan blob file
- Blob file sync operations: The count of blob file sync operations
- Blob file sync duration: The time consumed when synchronizing blob file
- Blob GC action: The count of Titan GC actions
- Blob GC duration: The Titan GC duration
- Blob GC keys flow: The flow rate of keys read and written by Titan GC
- Blob GC bytes flow: The flow rate of bytes read and written by Titan GC
- Blob GC input file size: The size of Titan GC input file
- Blob GC output file size: The size of Titan GC output file
- Blob GC file count: The count of blob files involved in Titan GC
Pessimistic Locking
- Lock Manager Thread CPU: The CPU utilization of the lock manager thread
- Lock Manager Handled tasks: The number of tasks handled by lock manager
- Waiter lifetime duration: The waiting time of the transaction for the lock to be released
- Wait table: The status information of wait table, including the number of locks and the number of transactions waiting for the lock
- Deadlock detect duration: The time consumed for detecting deadlock
- Detect error: The number of errors encountered when detecting deadlock, including the number of deadlocks
- Deadlock detector leader: The information of the node where the deadlock detector leader is located
- Total pessimistic locks memory size: The memory size occupied by the in-memory pessimistic locks
- In-memory pessimistic locking result: The result of only saving pessimistic locks to memory.
fullmeans the number of times that the pessimistic lock is not saved to memory because the memory limit is exceeded.
Resolved-TS
- Resolved-TS worker CPU: The CPU utilization of the resolved-ts worker threads
- Advance-TS worker CPU: The CPU utilization of the advance-ts worker threads
- Scan lock worker CPU: The CPU utilization of the scan lock worker threads
- Max gap of resolved-ts: The maximum time difference between the resolved-ts of all active Regions in this TiKV and the current time
- Max gap of safe-ts: The maximum time difference between the safe-ts of all active Regions in this TiKV and the current time
- Min Resolved TS Region: The ID of the Region whose resolved-ts is the minimal
- Min Safe TS Region: The ID of the Region whose safe-ts is the minimal
- Check Leader Duration: The distribution of time spent on processing leader requests. The duration is from sending requests to receiving responses in leader
- Max gap of resolved-ts in Region leaders: The maximum time difference between the resolved-ts of all active Regions in this TiKV and the current time, only for Region leaders
- Min Leader Resolved TS Region: The ID of the Region whose resolved-ts is the minimal, only for Region leaders
- Lock heap size: The size of the heap that tracks locks in the resolved-ts module
Memory
- Allocator Stats: The statistics of the memory allocator
Backup
- Backup CPU: The CPU utilization of the backup thread
- Range Size: The histogram of backup range size
- Backup Duration: The time consumed for backup
- Backup Flow: The total bytes of backup
- Disk Throughput: The disk throughput per instance
- Backup Range Duration: The time consumed for backing up a range
- Backup Errors: The number of errors encountered during a backup
Encryption
- Encryption data keys: The total number of encrypted data keys
- Encrypted files: The number of encrypted files
- Encryption initialized: Shows whether encryption is enabled.
1means enabled. - Encryption meta files size: The size of the encryption meta file
- Encrypt/decrypt data nanos: The histogram of duration on encrypting/decrypting data each time
- Read/write encryption meta duration: The time consumed for reading/writing encryption meta files
Explanation of Common Parameters
gRPC Message Type
Transactional API:
- kv_get: The command of getting the latest version of data specified by
ts - kv_scan: The command of scanning a range of data
- kv_prewrite: The command of prewriting the data to be committed at first phase of 2PC
- kv_pessimistic_lock: The command of adding a pessimistic lock to the key to prevent other transaction from modifying this key
- kv_pessimistic_rollback: The command of deleting the pessimistic lock on the key
- kv_txn_heart_beat: The command of updating
lock_ttlfor pessimistic transactions or large transactions to prevent them from rolling back - kv_check_txn_status: The command of checking the status of the transaction
- kv_commit: The command of committing the data written by the prewrite command
- kv_cleanup: The command of rolling back a transaction, which is deprecated in v4.0
- kv_batch_get: The command of getting the value of batch key at once, similar to
kv_get - kv_batch_rollback: The command of batch rollback of multiple prewrite transactions
- kv_scan_lock: The command of scanning all locks with a version number before
max_versionto clean up expired transactions - kv_resolve_lock: The command of committing or rollback the transaction lock, according to the transaction status.
- kv_gc: The command of GC
- kv_delete_range: The command of deleting a range of data from TiKV
- kv_get: The command of getting the latest version of data specified by
Raw API:
- raw_get: The command of getting the value of key
- raw_batch_get: The command of getting the value of batch keys
- raw_scan: The command of scanning a range of data
- raw_batch_scan: The command of scanning multiple consecutive data range
- raw_put: The command of writing a key/value pair
- raw_batch_put: The command of writing a batch of key/value pairs
- raw_delete: The command of deleting a key/value pair
- raw_batch_delete: The command of a batch of key/value pairs
- raw_delete_range: The command of deleting a range of data
TiKV-FastTune dashboard
If performance issues of TiKV occur, such as QPS jitter, latency jitter, and latency increasing trend, you can check the TiKV-FastTune dashboard. This dashboard contains a set of panels that help you with diagnostics, especially when the write workload in your cluster is medium or large.
When write-related performance issues occur, you can first check the TiDB-related dashboards. If the issues are at the storage side, open the TiKV-FastTune page, browse and check every panel on it.
In the TiKV-FastTune dashboard, you can see a title that suggests a possible cause of the performance issues. To check whether the suggested cause is true, check the graph on the page.
The left-Y-axis of the graph represents the write-RPC QPS of the storage side, and a set of graphs on the right-Y-axis are drawn upside down. If the shape of the left graph matches that of the right graphs, the suggested cause is true.
For detailed metrics and descriptions, see the dashboard user manual.